 Jira & Confluence




 Bitrix24
Stopping at "human error"
If the answer is a person, ask one more why: what made the mistake easy to make? The fix that lasts is usually in a procedure, a design or a check.
Work
ProjectsTasks, sprints and milestones PagesDocs and knowledge base FormsSurveys, quizzes, booking FlowProcesses and mockupsIncident at work · step 2 of 3
Ask why until you reach a cause you can fix in a process, not a person. Check the other causes on a fishbone, rate the risk before and after, and give every action one owner and a due date.
No sign-up to start. The document stays editable in this browser; sign-in appears only when you save it to a workspace or invite a team.
We will ask you to confirm this address, then email you the recipient’s reply.
Start editing here — no sign-up. Send the result first; sign in only if you want to keep it in a workspace or invite your team.
The situation
The incident report says what happened. Now the team has to agree why it happened and what will stop it happening again. This live spreadsheet opens on the page without registration: the 5 Whys sheet checks that every why is answered, the fishbone counts contributing causes by category, the risk matrix scores each risk before and after the actions, and the action list shows what is overdue today.
How to use it
1
One or two sentences from the incident report: what happened, where and when. No causes yet.
2
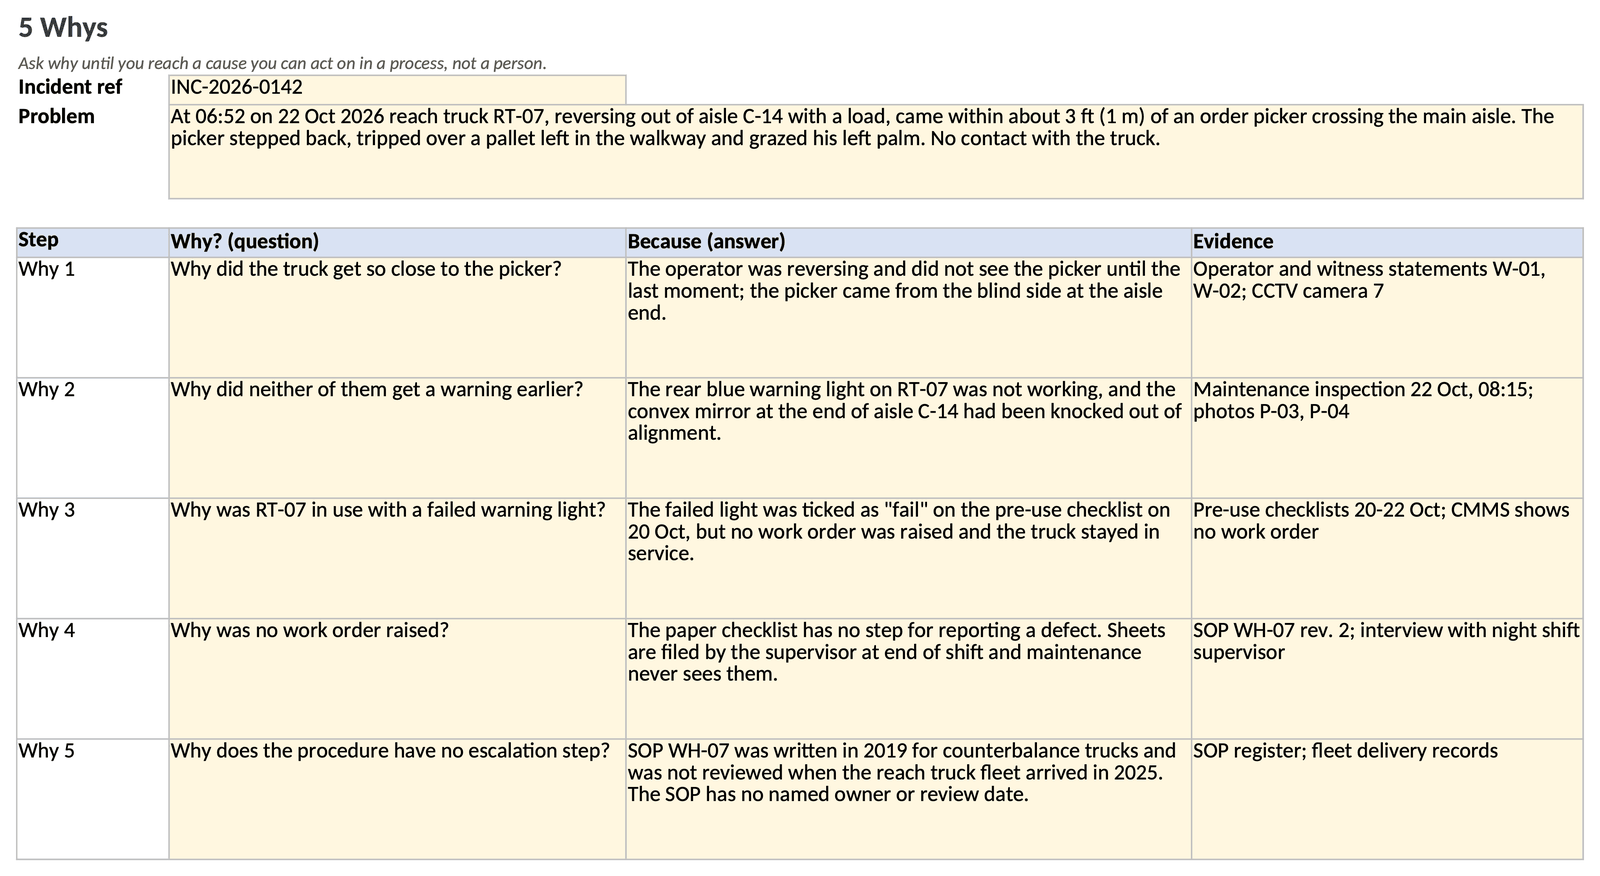
Each answer becomes the next question. Back every answer with evidence: a statement, a photo, a log entry.
3
List other causes under People, Methods, Machines, Materials, Measurement and Environment. Mark which ones the evidence shows contributed.
4
Rate likelihood and severity before and after. Give each action one owner, a type, a due date and a status, then send the sheet to the owners.
Filled example
The filled example continues the warehouse near miss. Five whys lead from "the truck got too close" to a pre-use inspection procedure with no step for reporting defects. The fishbone lists 14 causes, 11 of them contributing. Two critical risks drop to medium and low after the actions. Of 9 actions, 5 are done and 2 are overdue as of 16 Nov 2026.
Common mistakes
If the answer is a person, ask one more why: what made the mistake easy to make? The fix that lasts is usually in a procedure, a design or a check.
"Improve training" with no owner is a wish. The check line stays red until every action has an owner, a due date and a status.
Fixing the broken light is corrective. Changing the procedure so the next broken light is caught is preventive. You need both.
FAQ
It is free and you do not need an account to use the spreadsheet on this page. Sign-in appears only when you save it to a workspace or invite a team.
Both. The 5 Whys follows one chain of cause and effect deeply; the fishbone makes sure you have not missed causes in other categories.
No. Five is a rule of thumb. Stop when you reach a cause you can act on in a process; keep going if the answer is still a person or "bad luck".
Score = likelihood × severity, each from 1 to 5. Low is 1–4, Medium 5–9, High 10–15, Critical 16–25. You can change the thresholds in the formulas.
Yes. Use the same sheets: the problem is the outage, the fishbone categories still apply, and the actions go to the owning engineers.
Each owner gets a link to the workbook and opens it without an account. The Corrective actions sheet shows their rows, due dates and what is overdue as of the date you set.
We use no advertising cookies. With your consent we turn on Google Analytics to see which pages help; without it nothing is sent to Google. About cookies